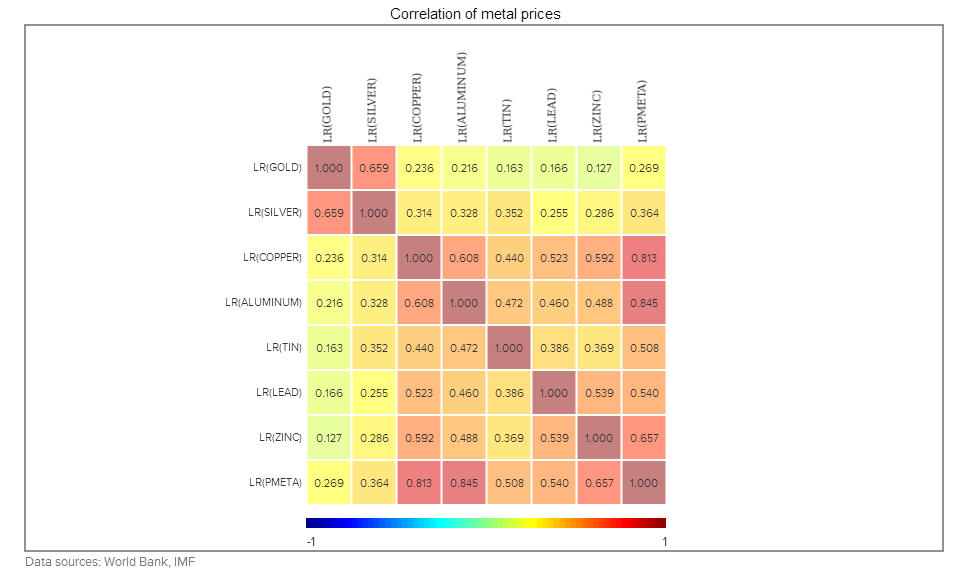
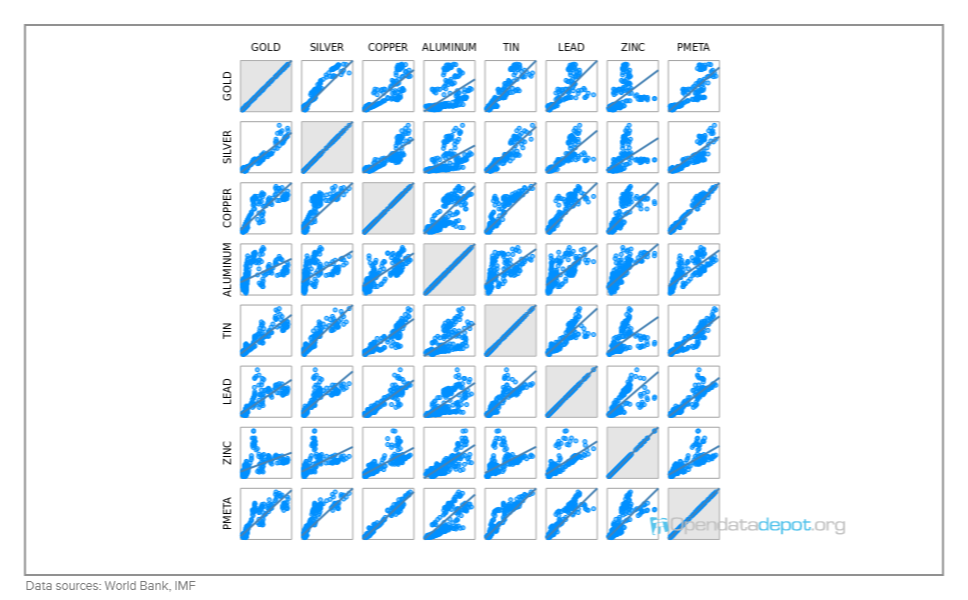
Correlation matrix (GCM)
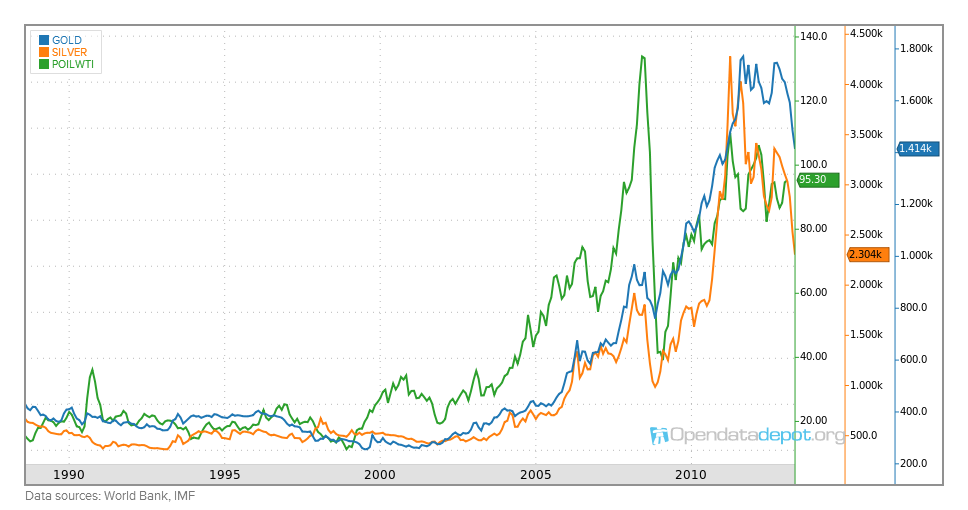
Simple line chart (GP) on multiple axis
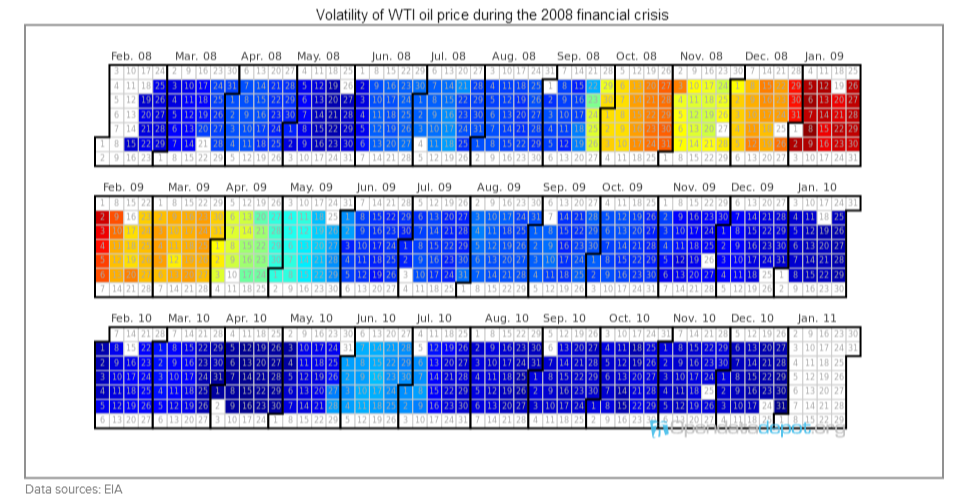
Calendar view (GCL) with Jet colormap
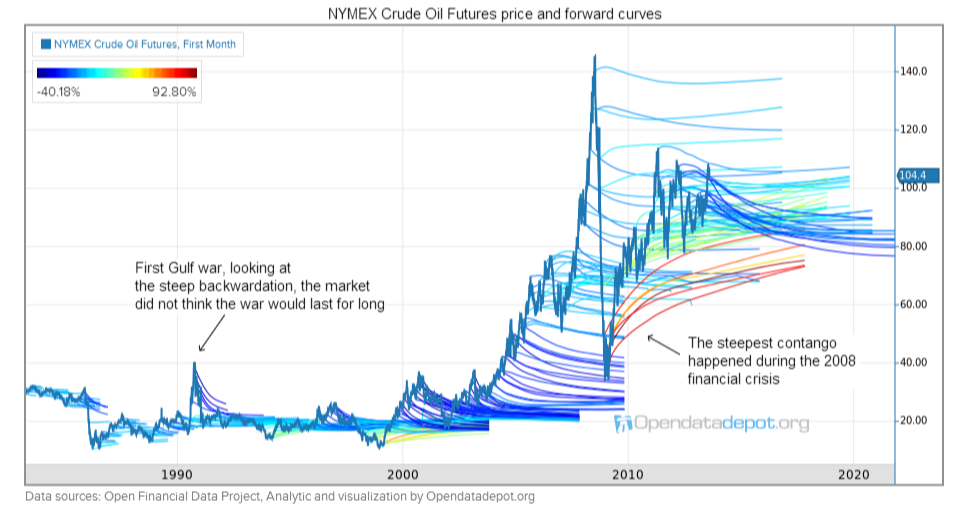
GP graph with future curves
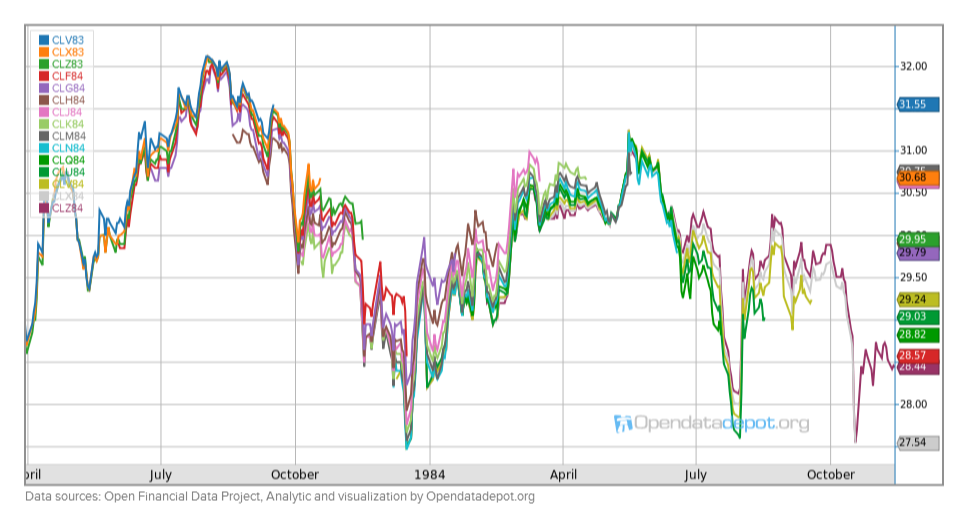
Forward curves (GFC)
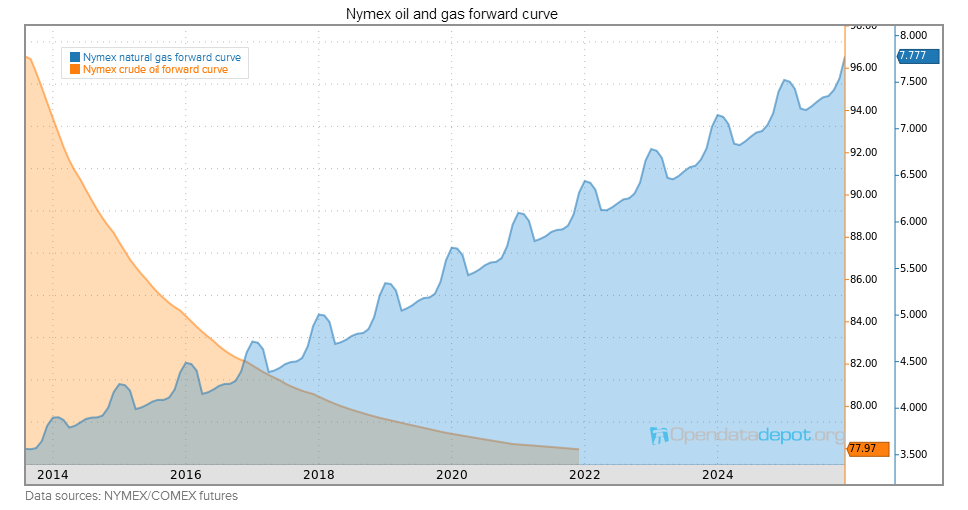
GP with binary graph type
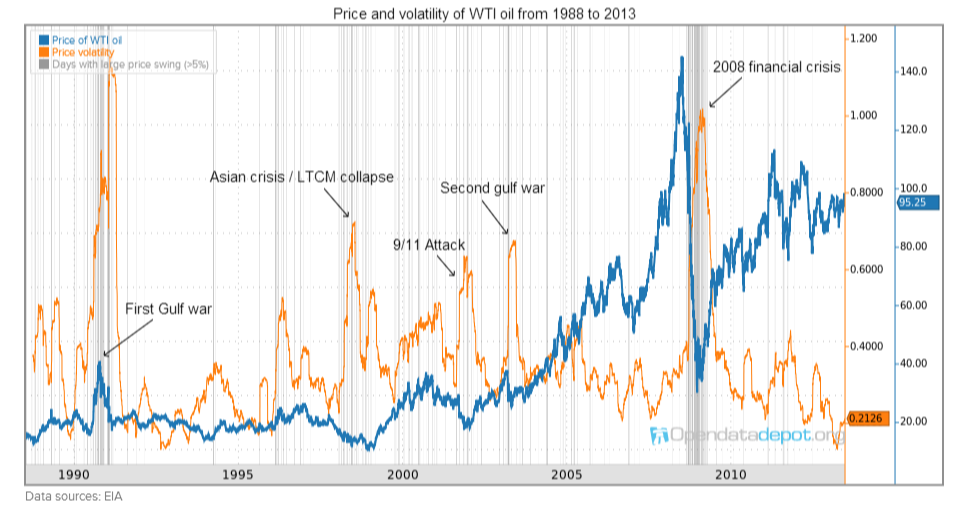
Bubble chart (GXY) with color based on year
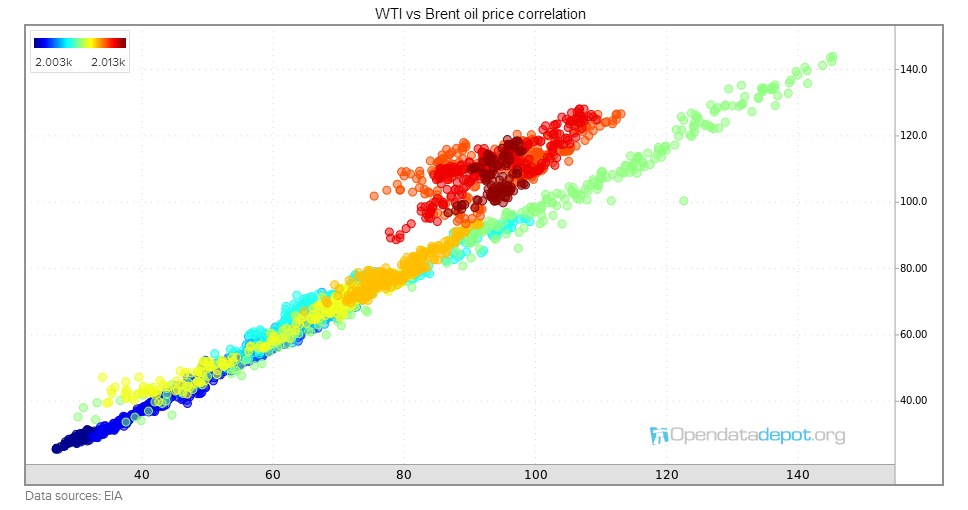
Scatter plot (GSP) with regression lines
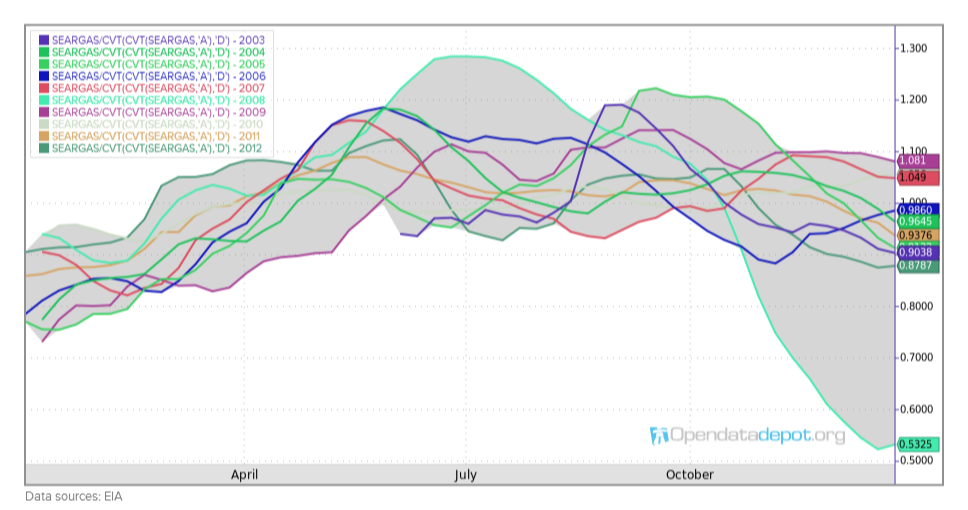
Seasonality plot (GPS) with shading
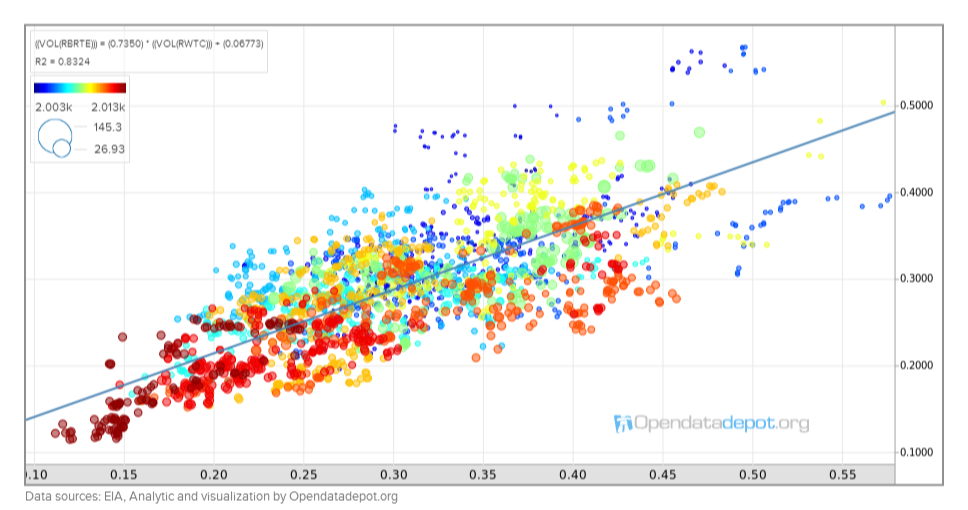
Bubble graph (GXY) with adjustable size and colors
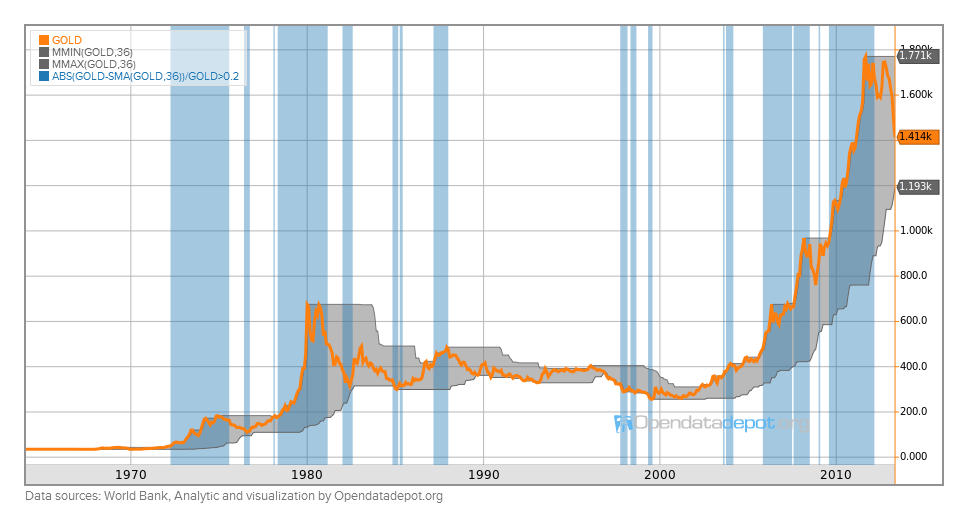
Gold price analysis with rolling price range (GP)
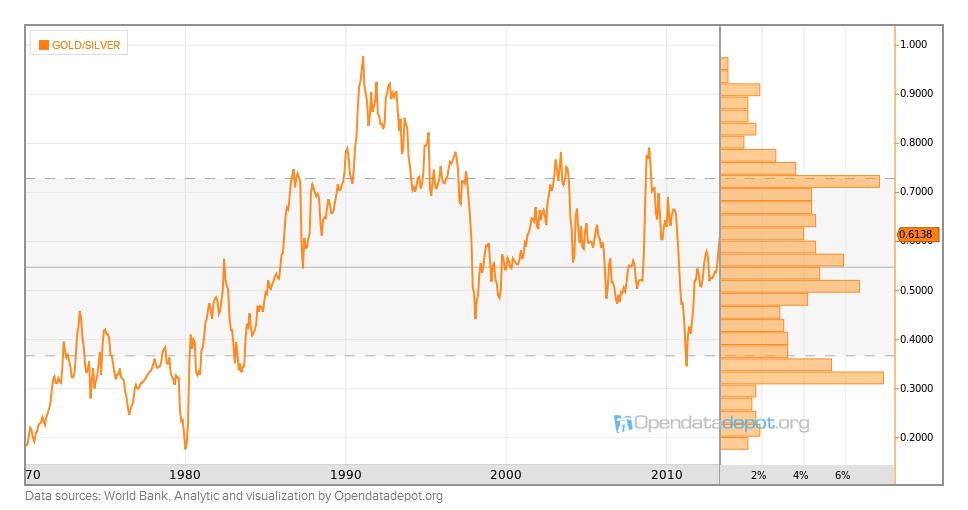
Line graph with histogram (GPH)
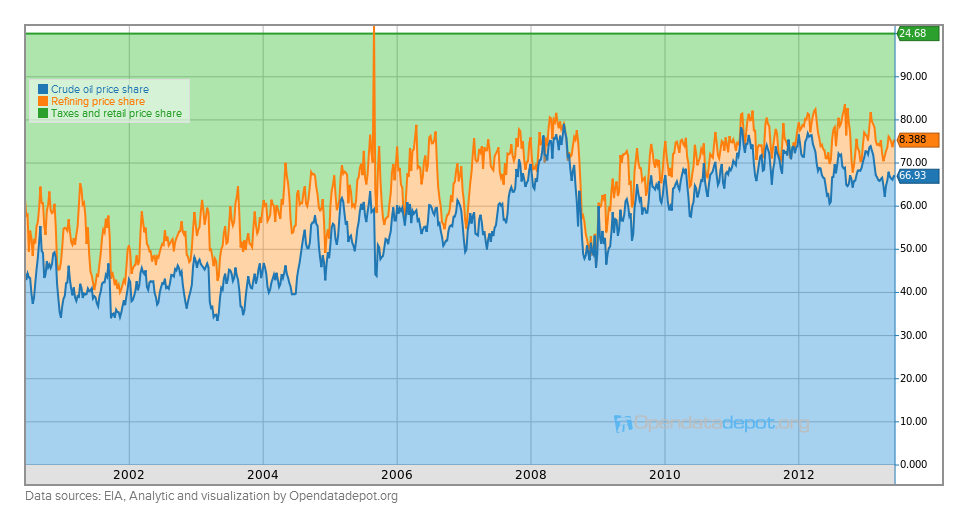
Stacked graph (GPA) with normalized mode on
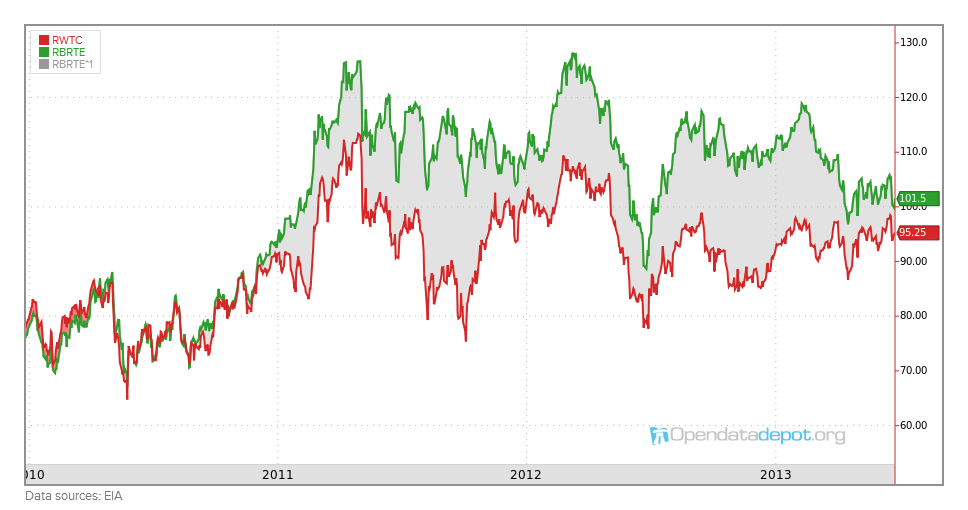
Difference graph mode with GP
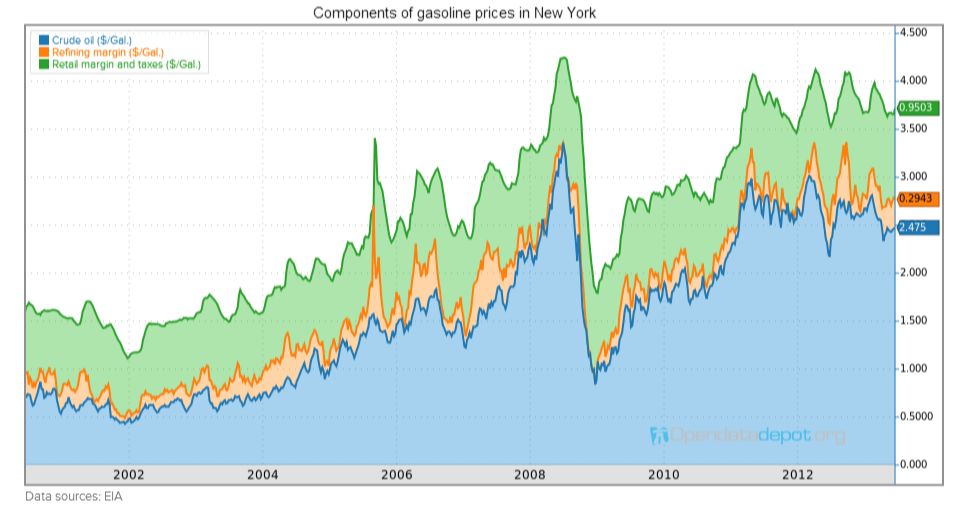
Stacked graph (GPA) in absolute mode
Forward curve shape over time (GFF)
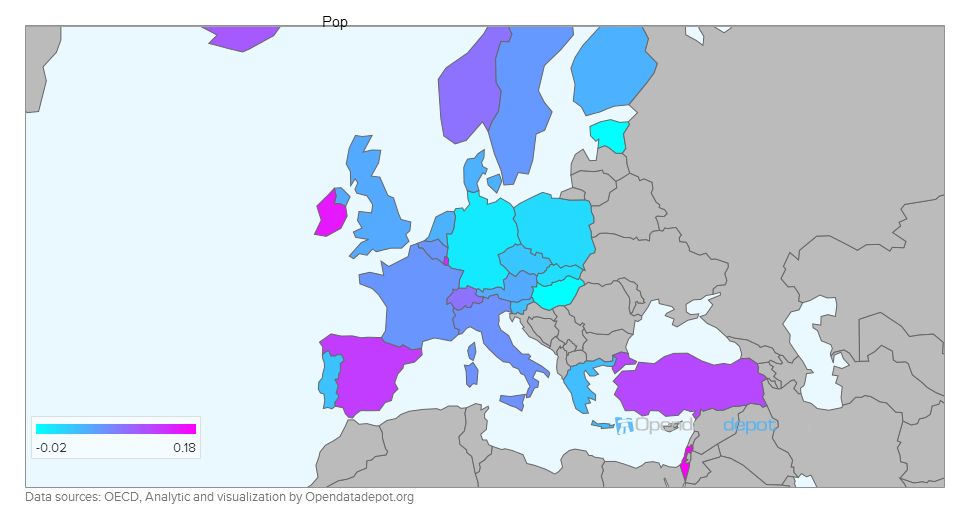
GEO: Population growth in Europe
